
Are you truly interested in selling on Amazon?
It’s obvious that online business is pointless if you don’t understand the numbers game.
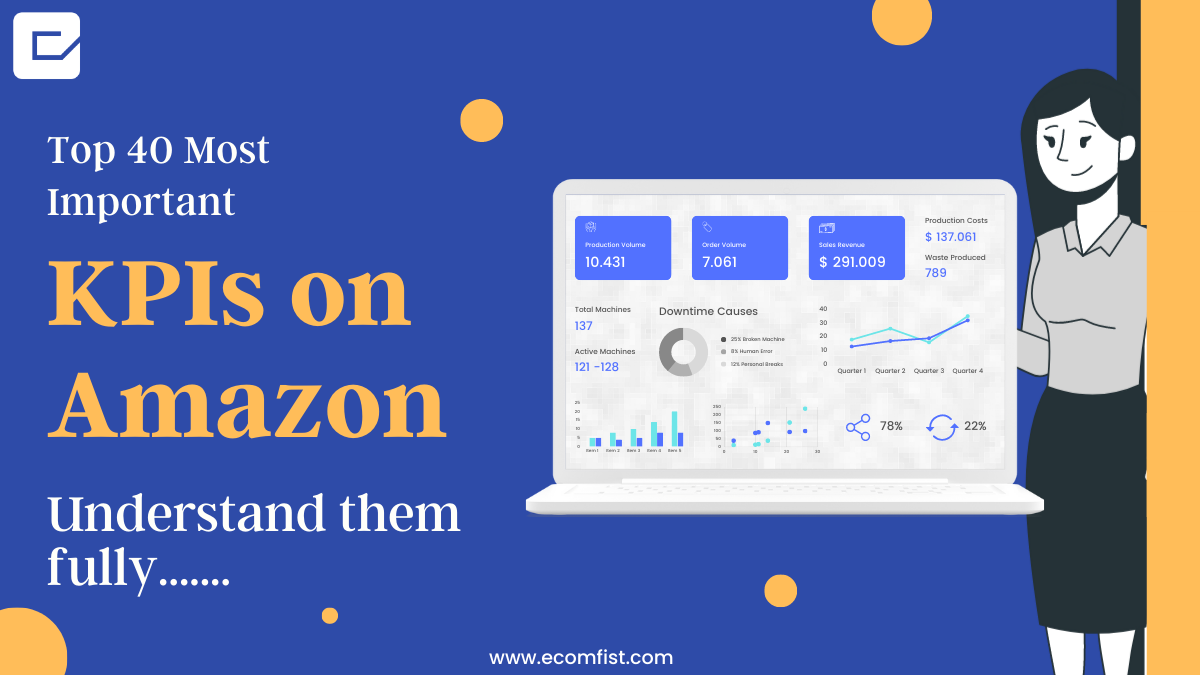
Amazon is all about precise calculations, and understanding KPI metrics is like knowing the math behind your Amazon operations. Without them, your failure is almost certain.
In short, if you want to avoid making excuses for why your business is struggling, you need to learn and apply these KPI metrics diligently. To help you out, we’ve compiled a list of 40 different KPIs to track, providing you with valuable information to align with both your short-term and long-term goals.
We’ll go into great depth on the most important key performance indicators (KPIs) while just skimming over the less important ones. This is based only on our own personal experience, and we believe it will help you successfully manage your Amazon business.
What is a KPI (Key Performance Indicator) for Amazon?
Key Performance Indicators, or KPIs, for Amazon are like the dashboard indicators in your Amazon seller central. They help you check the health of your business. Imagine driving a car – you rely on the speedometer, fuel gauge, and temperature gauge to know how things are running.
Similarly, key performance indicators (KPIs) on Amazon are data and numbers that reveal how many people are interested in your products, how many are purchasing them, and how much money you are making as a result. Using these figures, you can steer your business in the right direction and make smart decisions.
Why are Amazon’s KPIs important?
Do you know what would happen if you didn’t take KPIs into account?
Boom, you will be left with nothing.
See the picture below.
In business, you want to achieve a few specific goals in a particular time period. Right? And you want to see its ultimate success. You can’t tell if you’re making progress toward your goals until you measure the correct key performance indicator (KPI).
Consequently, without proper KPIs, you will lack focus, miss opportunities, divert resources away from higher-return areas, and ultimately hurt your business’s bottom line, customer retention rates, and staff retention. In the worst case scenario, it could cause the business to run out completely. In order to protect your business from potential harm, you shouldn’t ignore critical Amazon KPI metrics.
All Amazon KPI Metrics
This table shows all the KPIs that we are going to discuss in our blog.
| Advertising KPIs | Sales KPIs | Operational KPI | Customer Behavior KPIs |
| ACOS (Advertising Cost of sales) | Sales Revenue | Order Fulfillment Rate | Repeat Purchase Rate |
| ROAS (Return on Ad spend) | Gross Profit | Order Defect Rate | Churn Rate (Customer Attrition Rate) |
| TACOS | Gross margin | Return Rate | |
| CTR (Click-Through Rate) | Net Profit | Lost Buy Box Percentage | |
| CPC (Cost-Per-Click) | CTR (Click-through Rate) | In-stock Rate | |
| Ad Conversion Rate | AOV (Average Order Value) | Sales Velocity | |
| Ad Clicks | CLTV (Customer Lifetime Value) | Discount Redemption Rate | |
| Ad Spend | CAC (Customer Acquisition Cost) | ||
| Ad Revenue | Inventory Turnover |
Let’s start with Amazon advertising key performance indicators, because the earlier, the better.
KPIs for advertising on Amazon
1-ACOS (Advertising Cost of Sale)
ACOS looks at how much you spent on ads compared to the sales those ads generated. This Amazon KPI metric only focuses on direct sales from ads, not organic sales. Basically, it measures how well your ad campaigns are doing in terms of driving sales. This helps you see how successful your overall campaign strategy is during a specific period, as well as whether it’s positively impacting your Amazon business’s bottom line.
For example, if you spend $100 on ads and generate $500 in sales from those ads, after applying the formula, the ACOS would be 20%.
Significance: Basically, a lower ACOS is a good thing because it means you’re spending less money while still making good sales from your ads. It demonstrates that your campaigns are profitable and run efficiently. On the flip side, a high ACOS means you’re spending more on ads than the sales you’re getting from them, which isn’t great for your bottom line. Overall, this metric reveals if your PPC strategy is working or needs tweaking.
Unique Aspect: Ad profit can be maximized if ACoS is balanced with revenue.
2-ROAS (Return on Ad Spend)
Return on ad spend (ROAS) calculates how profitable your single advertising campaign was. It shows how much revenue you’re getting for every dollar you put into your ad campaigns. Actually, ROAS is the exact opposite of ACOS; however, unlike ACOS, it often provides numerical data rather than percentages to indicate the efficacy of a single marketing campaign. In other words, it’s straightforward data that tells you how many times you’re multiplying your ad spend. In short, it determines the return on investment (ROI) for marketing efforts.
For example, if you spent $20 on an ad campaign and it brought in $100 in sales, your ROAS would be 5. That means for every dollar you spent on ads, you got $5 back in sales.
Are you clear on the difference between ACOS and ROAS?
Okay. Let’s elaborate on it more.
Let’s suppose you manage multiple campaigns for a single product. If a campaign has a high ROAS, it indicates that the campaign is successful and profitable. By examining the report for that specific campaign, you might discover that a particular keyword is performing well due to its high ROAS. Based on this insight, you can adjust your ad strategy to focus more on that keyword. Moreover, to improve and drive more sales, you should bid higher on keywords that generate significant sales. On the other hand, for keywords that aren’t performing well, you can lower your bids to optimize your spending.
On the other hand, ACOS is used to measure the success of the overall campaign strategy rather than individual campaigns.

Significance: If your return on advertising spend (ROAS) is higher, then your advertising is profitable. It’s a simple ratio that compares the amount of money made to the amount spent on advertisements.
Unique Aspect: Connects the dots between advertising costs and profits.
3-TACOS ( Total Advertising Cost of Sales)
Don’t mix up TACOS with ACOS. That extra “T” in TACOS adds significant value.
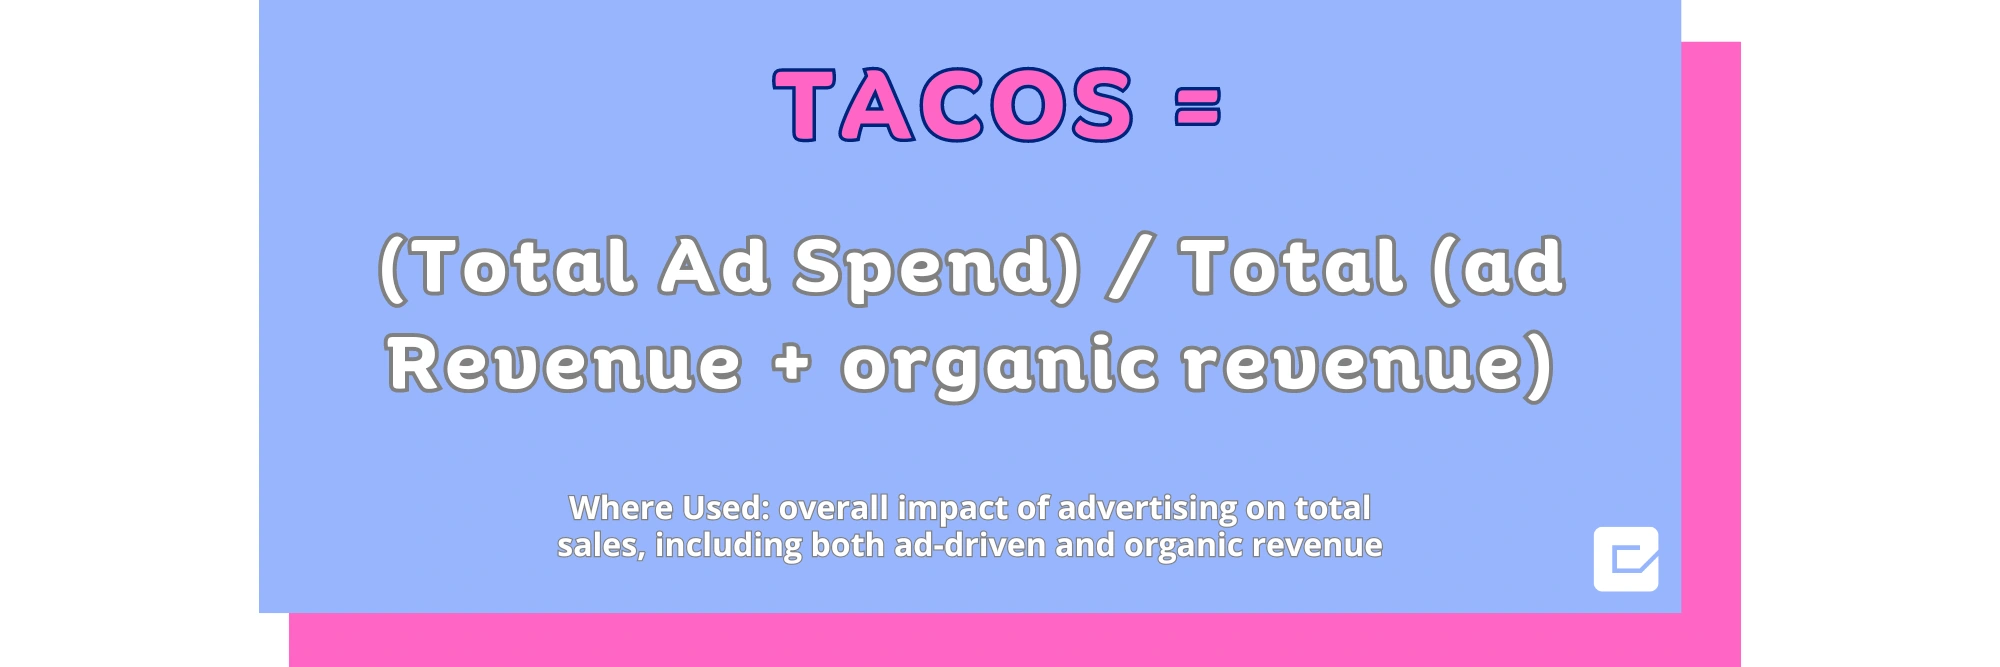
TACOS provides insight into your overall Amazon business performance. It measures your ad spend in relation to your total revenue, including both ad-driven and organic sales. This helps you understand how your campaigns affect your company’s total revenue growth, not just revenue from ads like ACOS. Remember, the goal of your ads isn’t just to drive sales directly through ads but to boost organic traffic and attract customers who search for your product on their own.
For example, if you spend $2000 on ads and generate $6000 in revenue from ads plus $4000 from organic sales, your TACOS would be 20%.
So, is 20% a good TACOS?
Kind of, but ideally, a TACOS around 15% is considered best. The higher your TACOS, the lower your profit margin. For example, if your TACOS is 30% and your profit margin is also 30%, you’re on break even (no profit, no loss). However, if your TACOS goes above your profit margin, you’re operating at a loss.

Significance:
- Low TACOS: If your TACOS is decreasing or staying the same, it likely means your advertised product is maintaining strong or steady sales. This suggests that organic sales are becoming a bigger part of your total revenue, showing that your advertising is effectively boosting your brand’s growth.
- High TACOS: If your TACOS is increasing, it generally indicates that your ads aren’t helping to drive organic sales. This could mean your campaigns or product pages need improvement to perform better.
Summary: ACOS, ROAS and TACOS
|
ACOS |
ROAS |
TACOS |
|
| Definition | ACOS looks at how efficiently your overall campaign is performing by comparing ad spend to the revenue generated from those ads. It’s shown as a percentage. | ROAS evaluates the effectiveness of individual campaigns, showing how much revenue you’re earning for every dollar spent on ads. This metric is presented as a number. | TACOS measures the efficiency of your entire business by comparing your ad spend to your total revenue, including both ad-driven and organic sales. |
| Positive Indicators | Low ACOS | High ROAS | Low TACOS |
| Negative Indicators | High ACOS | Low ROAS |
High TACOS |
For Example
Let’s say you’re the owner of an Amazon storefront. You’ve made the decision to put money into advertising in an effort to raise sales.
Advertising Costs:
Video ads: $ 800
Sponsored product ads: $700
Sponsored brand ads: $1500
Total Advertising Cost: $3000
Total Sales Generated from Ads:
Total Sales from Ads: $10000
Total Revenue from organic sales: $12,000
Calculations
ACOS = (Advertising Cost / Total Sales) * 100
ACOS = ($3000 / $10000) * 100 = 30%
According to ACOS, you spent about $30 on advertising for every $1 in sales that your ads generated in.
ROAS = (Revenue from Ads / Advertising Cost)
ROAS = ($10000 / $3000) = 3.33
Return on ad spend indicates that you made $3.33 for every dollar spent on ads.
TACOS = (Total Advertising Cost / Total Sales organic + ads generated ) * 100
TACOS = ($3000 / $22000) * 100 = 13.6%
TACOS analyzes your advertising costs across all channels and compares them to your gross sales revenue. The percentage shown indicates that advertising contributed to sales by 13.6% of the total.
4-Click-Through Rate (CTR) for Sponsored Products/Brands
CTR estimates how many people actually took action (clicked an ad) after seeing an advertisement or link.

For clarity, let’s say an ad was shown to 1,000 people and 100 of them clicked on it; in this case, the CTR would be determined by:
CTR = (100 / 1,000) * 100 = 10%
Significance: When the CTR is high, it usually means that the ad or link is interesting and useful to the target audience. If more people clicked on the ad or link, it means that they found it intriguing.
5-Cost-Per-Click (CPC) for Sponsored Products/Brands
It tracks the cost per click of an advertisement. Simply put, cost-per-click (CPC) is the amount an advertiser pays each time a user clicks on their ad.
Pay-per-click (PPC) advertising strategies rely heavily on cost-per-click (CPC). It helps advertisers figure out how much they’re paying to get people to visit their website or landing page and keep them there.

If an advertiser spends $500 on an ad campaign and gets 200 clicks, the cost per click (CPC) is determined by:
Cost per Click = $500 / (200) = $2.50
Significance: To maximize their return on investment (ROI), many advertisers prioritize lowering their cost per click (CPC) without sacrificing click quality or relevancy.
6-Ad Conversion Rate
Where It’s Used: Measuring how many people who click on an ad actually buy something.

7-Ad Clicks
Where It’s Used: Counting how often people click on ads
Significance: It has a direct effect on CTR and CPC.
8-Ad Spend
Where Used: Keeping tabs on how much money is spent on advertisements.
Unique Aspect: Directly influences campaign visibility and earnings potential.
9-Ad Revenue
Where It Is Used: For the Purpose of Estimating Advertising Profits.
Unique Aspect: It connects advertising efforts to tangible financial outcomes.
10-Discount Redemption Rate
The Discount Redemption Rate is the proportion of customers who make use of a given discount or coupon offer. You can see how many customers are taking advantage of your deals and how successful your discount promotions have been.

Significance: When your discount activities have a high redemption rate, it means that your audience is responding positively to them, which could translate into additional sales.
- Statistics on the average coupon usage .
- Discounts of 1%–5%; frequency of use >35%
- Discounts of 6%–9%; frequency of use: 45%
- Discounts of 10%–14%; frequency of use: 55%
- discounts of 15%–20%; frequency of use: 60%
- Discount: 21%+; Utilization Rate: 70%
What’s the point of keeping a check on it?
If your product’s coupon redemption rate is significantly greater than the average of its category, you are likely underpricing it.
Don’t forget that you have to pay $0.6 per coupon to Amazon when you use it.
Sales KPIs for Amazon
1-Sales Revenue
This metric is used throughout an Amazon business as a Standard for Measuring Revenue!

2-Gross Profit
The term “gross profit” is used in Amazon business to describe the amount of money a business keeps after deducting the costs directly related to the production of goods (COGS).

You can assess a business’s production efficiency before deducting any operational costs, by looking at its gross profit.
3-Gross Margin
A business’s gross margin is the amount of money that remains after paying manufacturing (production) costs. It’s a good indicator of whether or not a business can successfully manage its production costs and turn a profit from its main activities.

A higher gross margin suggests that a business is better able to manage its production costs, leading to more profits.
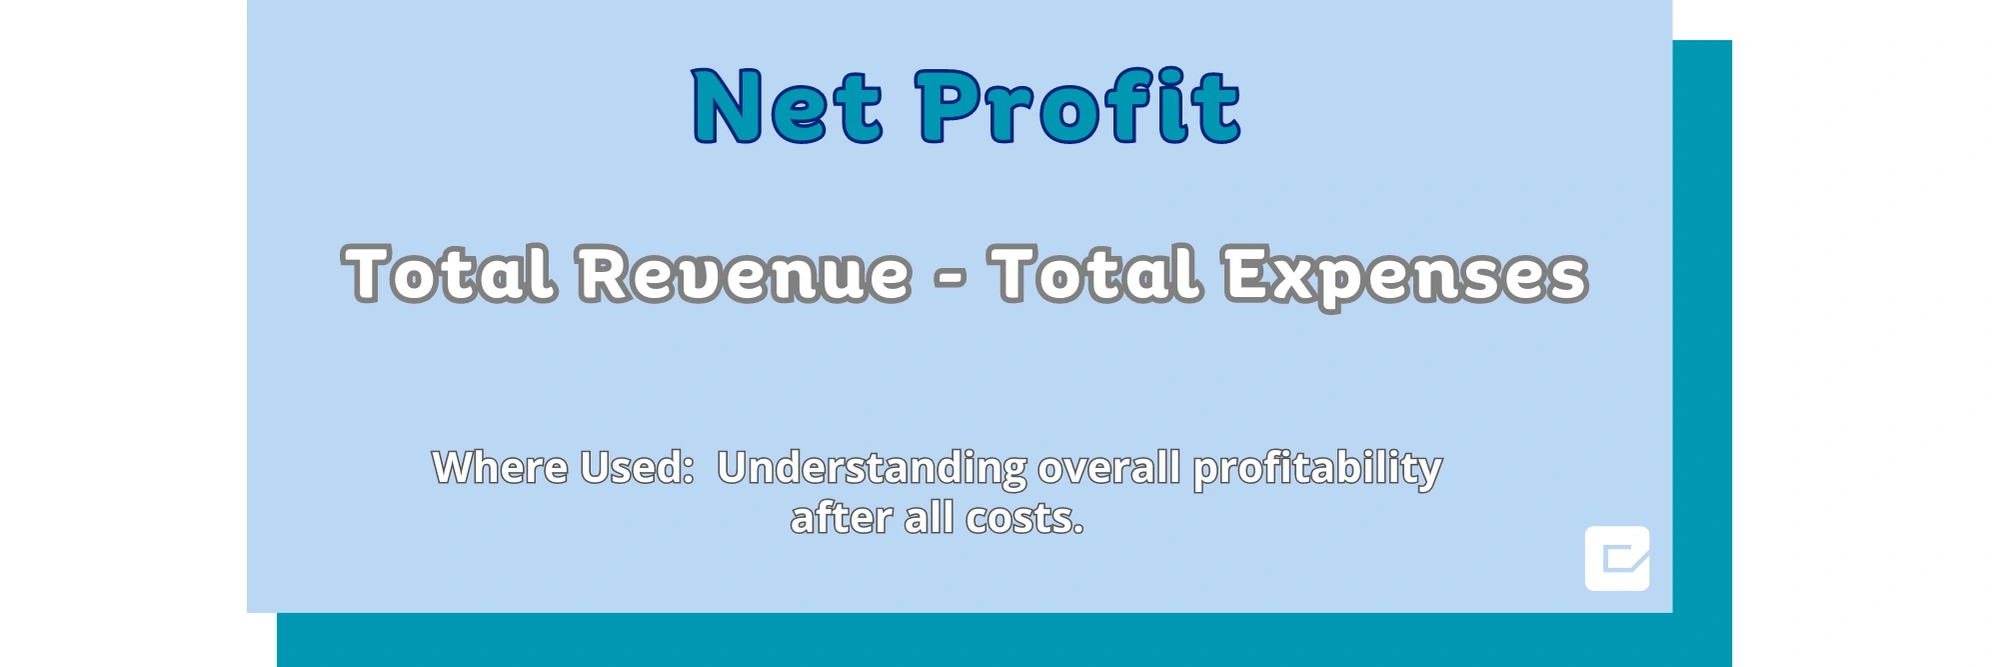
4-Net Profit
After deducting all expenses from revenue, including operational costs, interest, taxes, and other non-operating expenses, the remaining amount is the net profit, or bottom line. When all costs are factored out, a company’s net profit gives an accurate picture of its financial health.
5-Return on Investment (ROI)
Return on investment (ROI) is the amount of profit made in relation to the amount invested. The return on investment (represented as a percentage) is an essential metric for comparing the value of potential investments.

Unique Aspect: It evaluates the profit or loss in terms of the initial investment.
6-Average Order Value (AOV)
A business can see how much money their average customer spends on their products by calculating their “Average Order Value,” or AOV. It’s a helpful indicator of sales performance that can shed light on customer behaviors and preferences.

For example, if a company’s total revenue is $10,000 and they have 200 orders, the AOV would be:
AOV = $10,000 / 200 = $50
Significance: This metric can help you decide on the best pricing, upselling, and advertising approaches.
7-Customer Lifetime Value (CLV)
Customer LTV is the sum of money a business expects to earn from a single customer over the course of their entire collaboration with that organization. It’s useful for calculating the lifetime value of a customer and making informed decisions about how to keep and engage that customer.

If a consumer spends $50 per transaction, makes three purchases per year on average, and remains a customer for five years, the Lifetime Value (LTV) would be:
LTV = $50 × 3 × 5 = $750
Significance: Long-term value (LTV) helps businesses allocate resources in order to retain their most profitable customers and boost profits.
8-Customer Acquisition Cost (CAC)
The total amount a business spends to bring in a brand new customer is known as the Customer Acquisition Cost (CAC). It incorporates everything spent on customer acquisition and retention, including marketing, sales, advertising, and more.

If a business invests $10,000 in marketing and advertising and gains 100 new customers, its customer acquisition cost (CAC) is
CAC = $10,000 / 100 = $100
Significance: By comparing the price of customer acquisition to the revenue it brings in, CAC provides businesses with useful insight into the profitability of various customer acquisition strategies.
9-Inventory Turnover
Inventory Turnover is a key indicator of how well a business handles its inventory. This metric measures the turnover rate of a business by revealing the frequency with which inventory is sold and replaced during a given time frame.
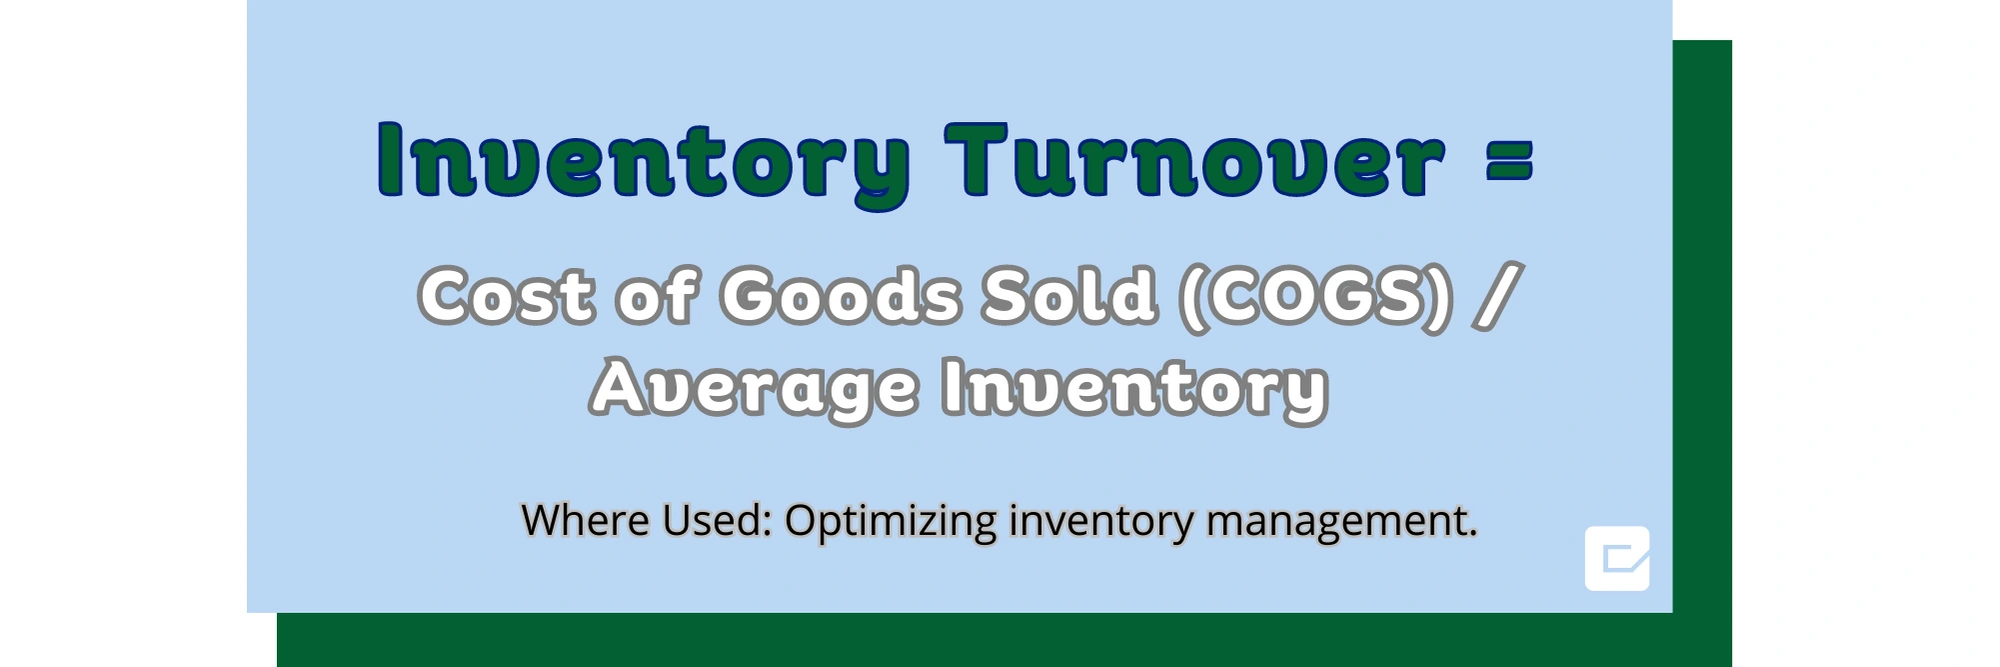
Significance: A higher turnover rate is indicative of careful inventory management, whereas lower turnover rates may point to surplus inventory.
10-Average Purchase Price (APP)
The term “Average Purchase Price” (or “APP”) refers to the typical amount customers spend while purchasing your product. It is calculated by dividing total sales by the total number of purchases.

For example, if you made $5,000 from 100 purchases, the average price of those purchases would be:
The sum of all purchases divided by 100 is $50, on average.
Significance: Businesses can use AVP to better understand their consumers’ usual spending behavior, which in turn influences pricing and advertising decisions.
11-Sales Velocity
This KPI shows how fast products sell in a certain amount of time. It sheds light on the turnover rate of products and the revenue they bring in. The sales velocity indicator takes into account both the volume and regularity of sales.

If you typically sell 50 units per week, your Sales Velocity would be:
Sales Velocity = 50 units × 1 week = 50 units/week
The rate at which products need to be replaced is a key factor in inventory management, making Sales Velocity an invaluable metric. It protects businesses from either overstocking or understocking their shelves.
Read More: Most popular Amazon items to sell for substantial profit in 2023
Operational KPIs for Amazon
1-Order Fulfillment Rate
Where Used: Measuring how well orders are processed.
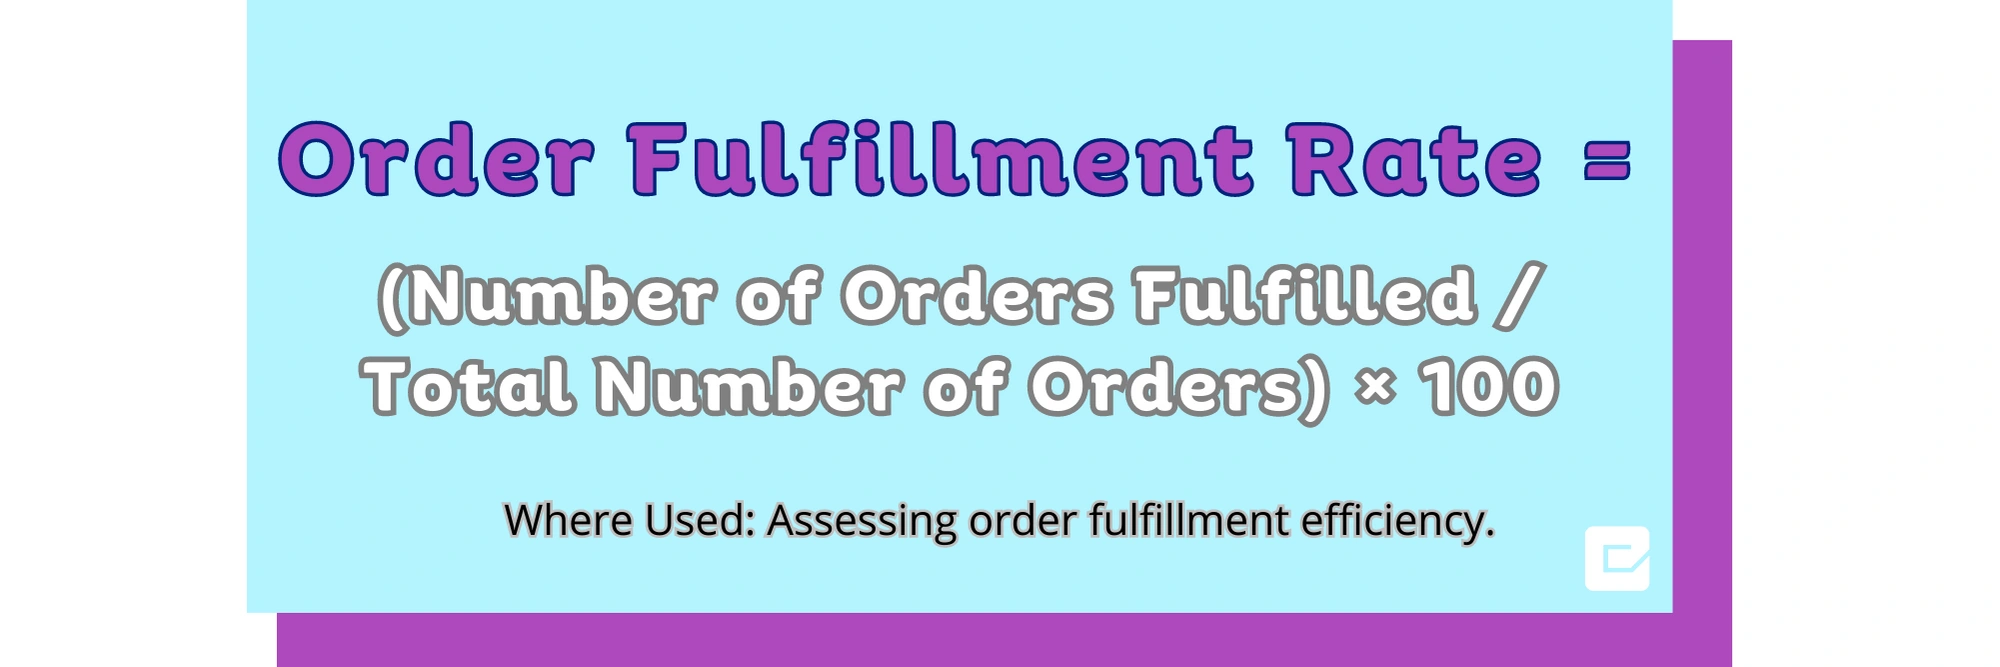
Unique Aspect: Guarantees orders are processed in a timely and comprehensive manner.
2-Order Defect Rate
Where Used: Checking in on how well orders are received and how satisfied customers are.
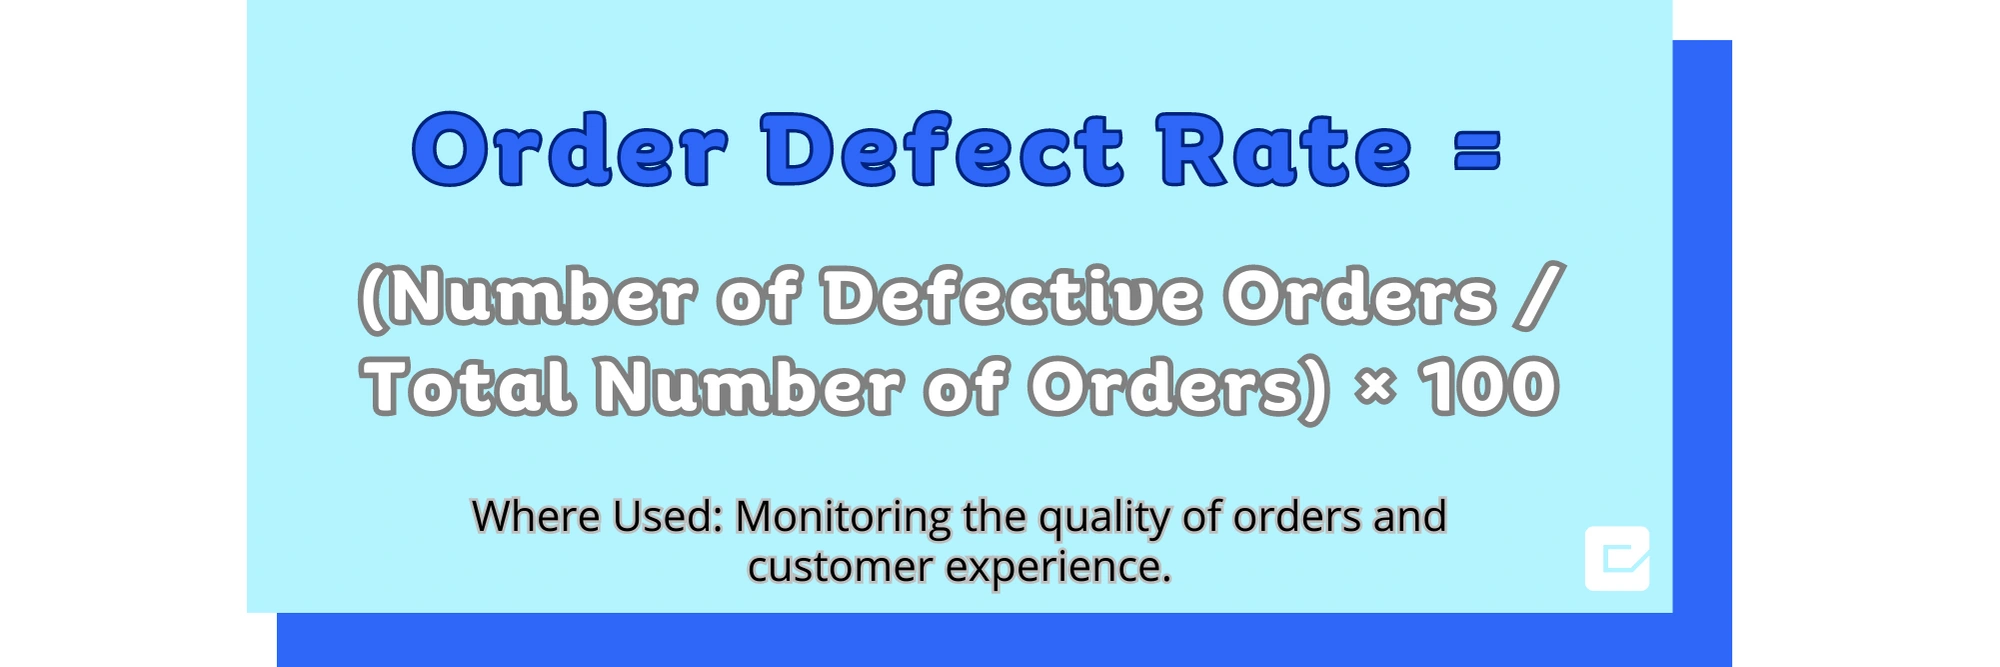
Unique Aspect: indicates the Trustworthiness of Products and Services.
3-Return Rate
Where Used: Measuring how often clients send back their purchased items.
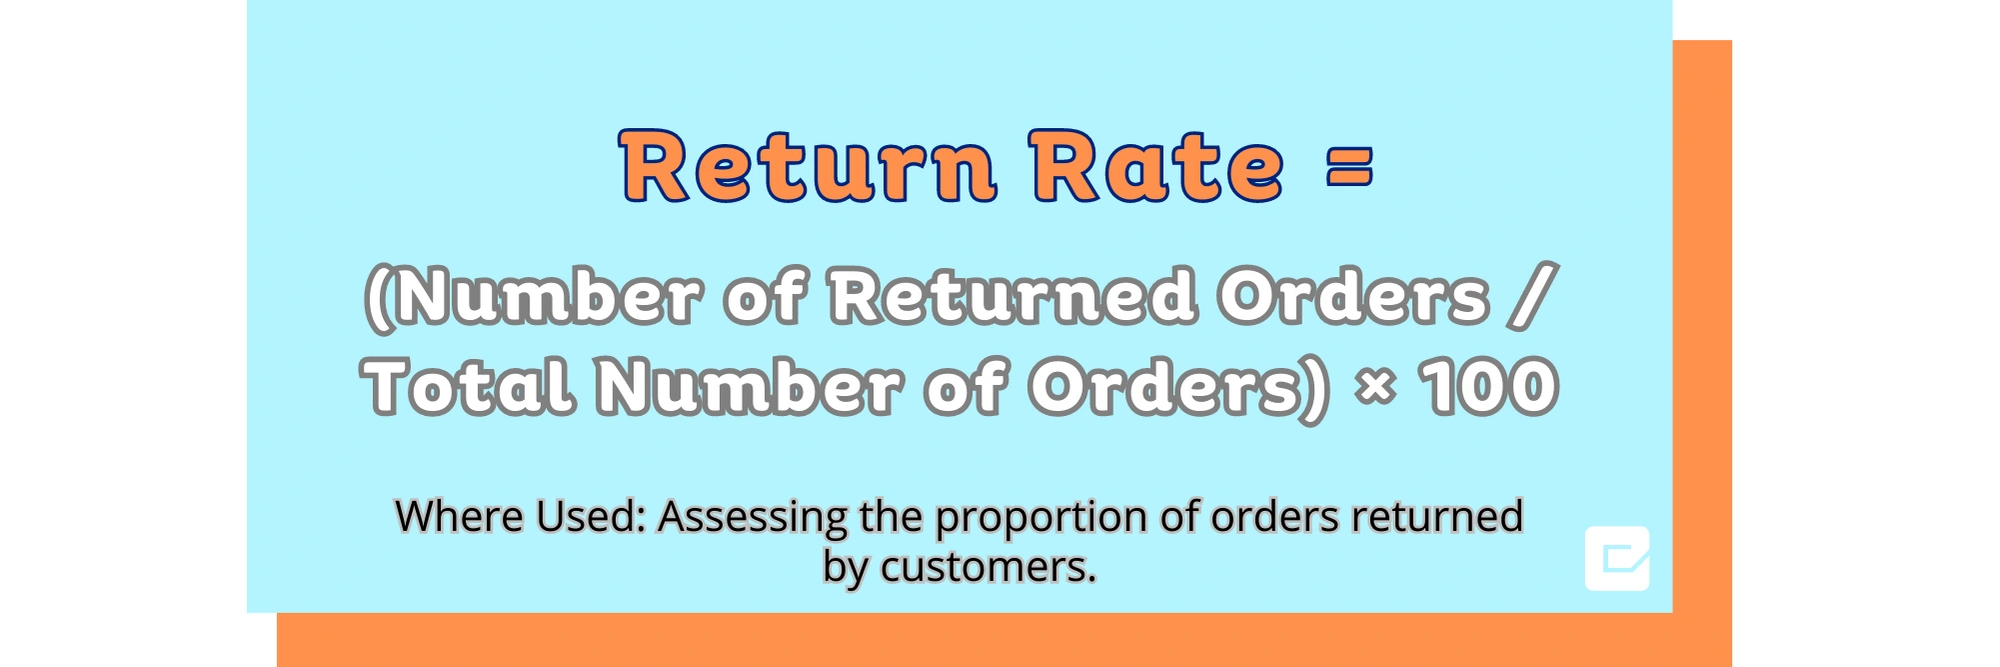
Unique Aspect: Reveals How Well Products Meet Accuracy and Customer Expectations.
Read More: How to differentiate your product on Amazon – Your Best Guide
4-Lost Buy Box Percentage
Useful When Assessing the Regularity of Missing Out on the Buy Box.

Unique Aspect: It affects revenue because the Buy Box is such a powerful conversion engine.
5-In-stock Rate
This metric ensures that products are consistently available for purchase in product listings.

Unique Aspect: influences both the conversion rate and the satisfaction of customers.
6-Out of stock Rate
The OOS Rate (or Out of Stock Rate) measures the frequency with which a product is temporarily unavailable for purchase. It represents the frequency with which customers find themselves unable to purchase something they want.

If you counted your stock 500 times and 50 times found that some items were missing, that’s your out-of-stock rate.
Out of stock rate = (50/500) x 100 = 10%
Significance: A lower out-of-stock rate indicates better control over stock levels and product availability for buyers. High rates of out-of-stock items might result in lost revenue and irritated customers.
Customer Behavior KPIs for Amazon
1-Repeat Purchase Rate
This KPI analyzes the proportion of customers who have made multiple purchases from your product listings during a given time frame. It is an essential metric for grasping customer loyalty and the efficacy of your retention strategies.

For example, if you have 500 customers and 200 of them have made more than one purchase, the Repeat Purchase Rate would be:
Repeat Purchase Rate = (200 / 500) * 100 = 40%
A high rate of recurrent purchases indicates that your customers were satisfied with their initial purchase and are making additional ones. It is a crucial indicator of consumer loyalty, the success of your products, and customer engagement initiatives.
2-Churn Rate (Customer Attrition Rate)
This KPI counts the proportion of customers who have disappeared while doing business with your business during a given time frame. It reflects the rate at which consumers leave your products, or “churn.”
For example, if you had 1000 customers at the beginning of the month and lost 50 by the end of the month, the Churn Rate would be: Churn Rate = (50 / 1000) * 100 = 5%.
A higher churn rate indicates that customers are leaving your product listings for others, which can have a negative impact on revenue and growth. It is essential to monitor and reduce churn rates to maintain a healthy customer base and business sustainability.
Why juggle all these KPIs? Let eComFist take care of the heavy lifting for you!
Key Performance Indicators (KPIs) might seem like a maze to unravel, especially in the lightning-fast world of e-commerce. It can be difficult to keep track of all the different metrics that need to be monitored, from sales and marketing to operational and customer behavior KPIs. eComFist provides a robust answer to this problem by simplifying the way in which you keep tabs on key performance indicators. eComFist allows you to put your attention where it belongs: on expanding your business and making strategic decisions with the help of cutting-edge analytics and automated insights.
Contact us to learn more about our strategies.